Quantum gis
Содержание:
[править] Выбор и установка пакетов
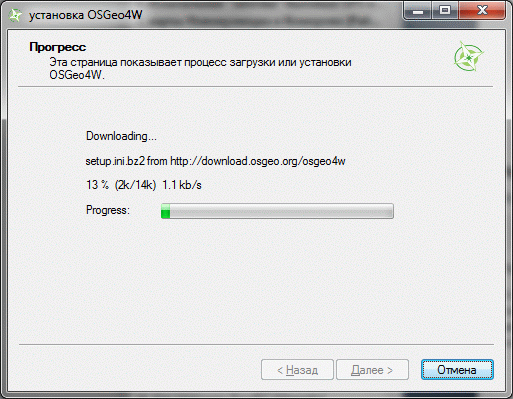
Примечание:
Если Вы получили сообщение об ошибке:
Попробуйте временно отключить брандмауэр (firewall) Windows (Пуск\Панель управления\Брандмауэр).
Если все прошло нормально, после загрузки установщик перейдет в состояние выбора пакетов. Выбор пакетов осуществляется из Cygwin-подобного дерева пакетов, при этом выбор одного из них, автоматически включает необходимые зависимости, без которых этот пакет не сможет работать, что очень удобно.
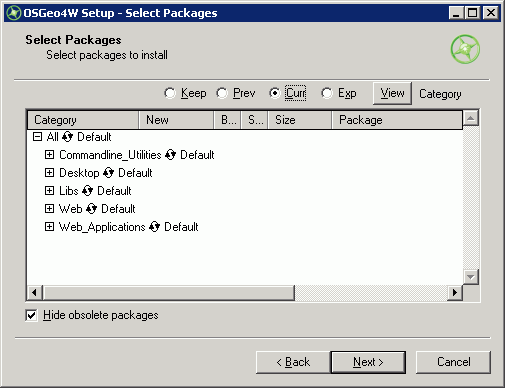
Для установки какого-либо компонента нужно найти его в дереве и нажимать на круговую стрелку до тех пор пока надпись Skip не изменится на название пакета
Важно: не нажимайте на кнопку Default у названия группы компонентов! Это приведет к установке многочисленных пакетов, которые не имеют отношения к QGIS. ->
->
Это приведет к переключению Default на Install и установке всех компонентов из группы, а этого в нашем случае делать не нужно. Необходимо сначала раскрыть группу, а потом установить некоторые из ее компонентов, перечисленные ниже. Например:
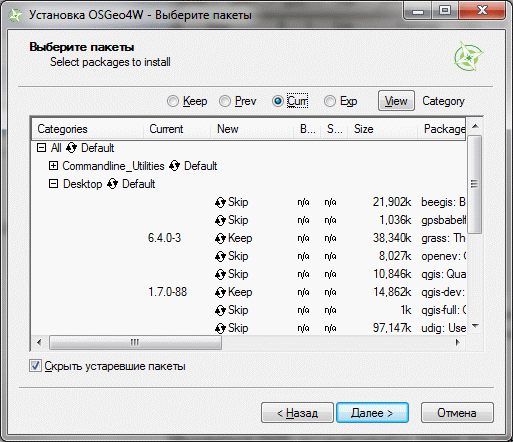
Для полной установки QGIS/GRASS, выберем следующие компоненты (версии могут отличаться от показанных на иллюстрации), при выборе некоторых из них, будут автоматически включаться и другие модули (зависимости), это нормально, выключать их не нужно:
Desktop: qgis-dev (обновляется ежедневно, т.н. ночные сборки)
Libs: gdal-python
Внимание: если вы только начинаете пользоваться QGIS, устанавливайте только эти пакеты, других пакетов пока включать не нужно. Окно программы должно выглядеть именно так как на иллюстрации выше, только цифры в колонке Current будут немного другими
Нажимаем Next.
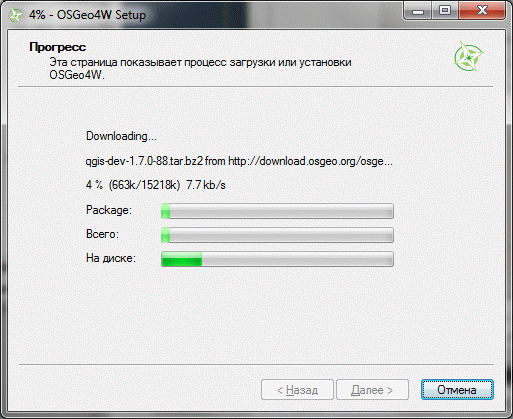
OSGeo4W автоматически загрузит и установит те пакеты, которые мы выбрали и все связанные с ними (таким образом загружено будет больше пакетов, чем было выбрано).
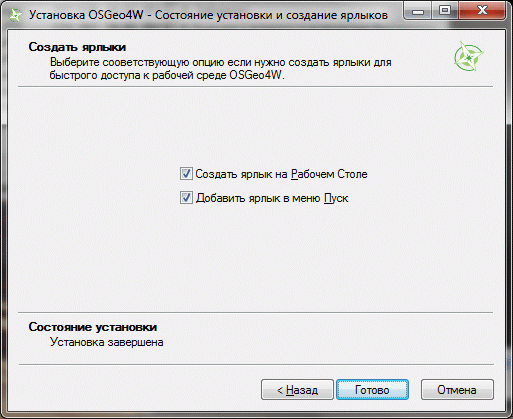
После окончания установки будет предложено создать ярлыки на рабочем столе и меню Пуск Windows. Если в составе пакетов был выбран и QGIS/GRASS, то соответствующий ярлык будет установлен и для него в группу OSGeo4W.
Другой способ запуска установленного QGIS: запуск OSGeo4W Shell и команда qgis.
В дальнейшем, при использовании некоторых модулей расширения, может понадобится доустановить определенные пакеты, например matplotlib для или обновить установленные. Для этого нужно будет просто еще раз запустить OSGeo4W и дополнительно выбрать не отмеченные в первый раз модули (например matplotlib), все остальные, уже установленные модули обновятся автоматически если это необходимо.
Координационная таблица
Если вы хотите принять участие в переводе — оставьте
сообщение на форуме, указав, какой из разделов вы хотите взять,
соответствующая строка таблицы будет заблокирована и в ней будет отражено ваше участие.
Серым цветом отмечены разделы полностью находящиеся в переводе (занятые),
красным цветом отмечены переведенные файлы, зеленым переведенные
и отредактированные.
Результаты принимаются в TeX.
Степень готовности. Всего: 207, готово: 207, в редакции: 0,
переводится: 0
Версия руководства 1.5
Перевод руководства
Скачать сборку руководства версии 1.7.0 от 15.09.2011, 20:29 (PDF, 10 Мб).
| Раздел | Страниц | Ссылки | Кто |
|---|---|---|---|
|
3 |
(рус)(eng) |
||
|
3 |
(рус)(eng) |
|
|
2 |
(рус)(eng) |
|
|
5 |
(рус)(eng) |
|
|
9 |
(рус)(eng) |
|
|
10 |
(рус)(eng) |
|
|
8 |
(рус)(eng) |
|
|
14 |
(рус)(eng) |
||
|
13 |
(рус)(eng) |
||
|
4 |
(рус)(eng) |
|
|
5 |
(рус)(eng) |
|
|
8 |
(рус)(eng) |
|
|
4 |
(рус)(eng) |
|
|
18 |
(рус)(eng) |
|
|
12 |
(рус)(eng) |
|
|
4 |
(рус)(eng) |
|
|
6 |
(рус)(eng) |
|
|
10 |
(рус)(eng) |
||
|
4 |
(рус)(eng) |
||
|
11 |
(рус)(eng) |
||
|
7 |
(рус)(eng) |
|
|
8 |
(рус)(eng) |
|
|
10 |
(рус)(eng) |
||
|
4 |
(рус)(eng) |
|
|
4 |
(рус)(eng) |
|
|
4 |
(рус)(eng) |
|
|
17 |
(рус)(eng) |
Обсудить в форуме Комментариев 149
Последнее обновление: September 15 2011
Procedure
-
Locate the downloaded file in the Browser panel and expand it. Drag the file to the canvas.
-
You will see a new layer loaded in the Layers panel. You will see that the layer has lines representing railroads for all of North America. Now, let’s calculate the lengths of each line feature. Go to Processing ‣ Toolbox.
-
Search for and locate the Vector geometry ‣ Add geometry attributes algorithm. Double-click to launch it.
-
In the Add Geometry Attributes dialog, select as the Input layer. The input layer’s Coordinate Reference System (CRS) is EPSG:4326 WGS84. This is a Geographic CRS with Latitude and Longitude as coordinates, WGS84 as ellipsoid and degrees as units. Because latitude and longitude don’t have a standard length, you can’t measure distances or areas accurately using planar geometry functions. Fortunately, QGIS provides a better way to compute distances using ellipsoidal geometry, which is the most accurate method for layers spanning large areas such as this. Pick as the Calculate using option. Click Run. Once the process finishes, click Close.
Примечание
If your input layer is in a Projected CRS, you may choose option for calculation. Local or Regional projected coordinate systems are designed to minimize distortions over their region of interest, so are more accurate for such computation.
-
You will see a new layer loaded in the Layers panel. This is a copy of the input layer with a new column added for distance. Right-click the layer and select Open Attribute Table.
Примечание
The Add Geometry Attribute tool adds different set of attributes depending on whether the input layer is points, lines or polygons. See for more details.
-
In the Attribute Table, you will see a new column called distance. This contains the length of each line feature in meters. Also note that the sov_a3 attribute which contains the country code for each feature. Close the Attribute Table window.
-
Now that we have lengths of individual railroad line segments, we can add them up to find the total length of railroads. But as the problem statement demands we need total railroad length in the United States, we must use only the segments contained within USA. We can use the country code value in the sov_a3 column to filter the layer. Right-click the layer and select Filter.
-
In the Query Builder dialog, enter the following expression and click OK.
-
You will see a Filter icon appear next to the layer in the Layers panel indicating that a filter is applied to the layer. You can also visually confirm that the layer now contains line segments only for United States. Now we are ready to calculate the sum. Click the Show statistical summary button on the Attributes Toolbar.
-
A new Statistics panel will open. Select layer and column.
-
You will see various statistics displayed in the panel. The unit of the statistics is the same as the units of column — meters. Let’s change the computation to use kilometers instead. Click the Expression icon next to the fields drop-down menu in the Statistics panel.
-
Enter the following expression in the Expression Dialog that converts the length to kilometers.
-
The Sum value displayed is the total length of railroads in USA.
[править] Особенности использования в ПО ГИС
Arcview
Запуск проекта: geosample-arcview.apr. Только Windows.
Не поддерживает группы слоёв, прозрачность, классификацию растров GeoTIFF. Использует растры рельефа в формате Arcinfo GRID. Для отображения данных о рельефе необходим установленный модуль Spatial Analyst.
GRASS
Кодировка атрибутивных данных UTF-8.
При использование самих данных: распаковать в любую папку, при запуске GRASS указать:
gvSIG
Запуск проекта: geosample-gvsig-linux.gvp или geosample-gvsig-win.gvp.
Не поддерживает относительные ссылки, классифицированные растры, прозрачность векторных слоёв. Для правильного отображения слоёв необходим установленный русификатор. Данные архива для Windows версии должны быть распакованы в c:\geosample, для Linux — /usr/share/geosample. Необходимо установить права на папку geosample: chmod 755 *.
OpenJUMP
Запуск проекта: c:\geosample\geosample-openjump.jmp или /usr/share/geosample/geosample-openjump-linux.jmp
Не поддерживает относительные ссылки, классифицированные растры.
QGIS
Варианты запуска:
- geosample-qgis.qgs, независимо от ОС. Проект с использованием shape-файлов и растров GeoTIFF.
- geosample-grass-qgis.qgs, независимо от ОС. Проект с использованием базы данных GRASS.
- geosample-sqlite-qgis.qgs, независимо от ОС. Проект с использованием SQLite/SpatiaLite базы векторных данных и растров GeoTIFF. Для работы с относительными путями необходим QGIS 1.4.0, а лучше . В более ранних версиях не работает сохранение относительных путей к БД, возможна потеря слоев.
В версиях QGIS 1.3 и ниже возможна потеря слоёв из-за непонимания относительных ссылок.
SpatiaLite GIS
Работа только с векторными данными, отсутствуют группы слоёв. Для использования: распаковать в любую папку, запустить SpatiaLite GIS и открыть ранее распакованную базу (подключиться к ней).
uDIG
Запуск проекта: указываем каталог udig-project.udig (linux), папку geosample (windows).
Не поддерживает относительные ссылки, группы слоёв, прозрачность. В версии под linux не удалось раскрасить слои, так как udig не определил поля шейп файлов. Данные архива для Windows версии должны быть распакованы в c:/geosample, для Linux — /usr/share/geosample.
General QGIS info
See also wikipedia:Quantum GIS.
Features
The major features of QGIS include:
- Direct viewing and exploration of spatial data
- Advanced symbology (edit rendering styles)
- QGIS Browser as a simple and fast data viewer
- Support for numerous vector, raster, and database formats
- ESRI shapefiles, GeoJSON, KML/KMZ, and GPX
- PostGIS, PBF, SpatiaLite, MSSQL spatial, WMS
- Create, edit and export spatial data
- Work with nodes, lines and polygons
- Convert between different coordinate systems (re-projection)
- Down/upload directly to a GPS unit
- Perform spatial analysis
- Find polygon centroids and basic statistics
- Distance matrix and line intersections
- Publish your map on the internet
- An extensible plug-in architecture
Other useful pages to bookmark:
Coordinate Reference System
Earth is a three-dimensional body, roughly spherical in shape, yet the vast majority of maps are flat (2-dimesional). A Coordinate Reference System (CRS) defines a method of projecting all or part of the Earth onto a 2D surface. QGIS has support for approximately 2,700 known CRS. Some, such as WGS-84 are global projections, whereas others represent only specific regions.
Setting the CRS
When working with geo-spatial data it is essential that you are using the correct CRS. If you are lucky the projection will be specified as part of the vector file (for example, ESRI Shapefiles often include projection data in the .prj file), however you will often have to manually select the correct CRS.
To specify the CRS of a vector layer, select the layer and choice Layer->Set CRS of Layer(s)…. Each layer can have a different CRS. If this is the case, you will need to convert them to the same CRS in order for them all to display correctly. The easiest way to do this is to use ‘on the fly’ CRS transformation:
- Settings->Project Properties (or click on the globe symbol in the lower right corner).
- Select the Coordinate Reference System (CRS) tab.
- Check the Enable ‘on the fly’ CRS transformation checkbox.
- Pick a suitable project CRS to work with (e.g. WGS-84).
Using QGIS to convert between CRS
QGIS can be used to convert between CRS. Open the input layer making sure to select the correct CRS as described above. Use Layer->Save As… to export the layer with a different CRS (you may choice between the «Project» CRS or select a CRS from QGIS’s extensive list).
Using QGIS to filter data from government sources and convert it to KML
In Sweden multiple government agencies give out data in large shapefiles. These files do not load nicely in JOSM because of their size and/or JOSMs premature shp support.
To filter out part of a shp file in QGIS you can do this:
- open the shp file in QGIS
- enable editing
- select a number of nodes and delete them
- rightclick on the layer and choose «Export..»
- select KML (this is better supported in JOSM)
- click save and open up the result in JOSM
Схема работы
Для участия в проекте вам понадобится:
- текстовый редактор с подсветкой синтаксиса LaTeX (для редактирования текстов)
- простой графический редактор (для создания скриншотов)
- регистрация на форуме
- компьютер с установленным QGIS версии 1.5 и набор данных Alaska
- периодический выход в Интернет
Исходный текст Руководства распространяется в виде файлов TeX (например, print_composer.tex) в кодировке UTF-8.
По сути это обычные текстовые файлы, открыть которые можно в любом текстовом редакторе. Для удобства работы
рекомендуется использовать редактор с подсветкой синтаксиса TeX/LaTeX. Редактор с поддержкой Unicode и подсветкой
синтаксиса LaTeX для Windows можно скачать здесь. Редактор не требует
установки, достаточно извлечь содержимое архива в какую-либо папку.
Рабочие наборы данных распространяются в виде архивов, внутри архива находится один или несколько файлов с
расширением .tex. Каждый файл .tex содержит главу или подраздел руководства. Один и тот же файл может входить в состав
нескольких наборов данных, в этом случае необходимо найти свою часть и перевести только ее.
В тексте документа встречаются блоки с описанием изображений, они выглядят вот так
\begin{figure}
   \centering
   \caption{\label{gpxloader}The \emph{GPS Tools} dialog window \nixcaption}
   \includegraphics{loadgpx}
\end{figure}
Строка, начинающаяся с \caption содержит подпись рисунка, которую необходимо перевести. После перевода приведенный
выше блок будет выглядеть так
\begin{figure}
   \centering
   \caption{\label{gpxloader}Диалоговое окно \emph{GPS Tools} \nixcaption}
   \includegraphics{loadgpx}
\end{figure}
Советы по переводу:
строки, начинающиеся со знака «процент» («%») являются комментариями, их просто
игнорируем
команды, начинающиеся символом «обратный слеш» («\») переводить и удалять не нужно.
Переводится только текст внутри фигурных скобок
Например,
\chapter{Introduction To GIS}\label{label_intro}
в русском варианте будет выглядеть как
\chapter{Введение в ГИС}\label{label_intro}
Обратите внимание, что текст в фигурных скобках после \label не переводится!
при переводе названий элементов интерфейса ориентируемся на локализацию QGIS. Если обнаружили не переведенные
или плохо переведенные элементы интерфейса — оставляем сообщение в соответсвующей
теме форума
при переводе терминов старайтесь придерживаться Словаря переводчика
3.1. Обзор
Vector data provide a way to represent real world features within the GIS
environment. A feature is anything you can see on the landscape. Imagine you are
standing on the top of a hill. Looking down you can see houses, roads, trees,
rivers, and so on (see ). Each one of these things would be a
feature when we represent them in a GIS Application. Vector features have
attributes, which consist of text or numerical information that describe
the features.
Рис. 3.13 Глядя на ландшафт, мы можем выделить основные объекты, например дороги, дома и деревья.
A vector feature has its shape represented using geometry. The geometry is
made up of one or more interconnected vertices. A vertex describes a position
in space using an X, Y and optionally Z axis. Geometries which have
vertices with a axis are often referred to as 2.5D since they describe
height or depth at each vertex, but not both.
When a feature’s geometry consists of only a single vertex, it is referred to as
a point feature (see illustration ). Where the geometry
consists of two or more vertices and the first and last vertex are not equal, a
polyline feature is formed (see illustration ). Where
three or more vertices are present, and the last vertex is equal to the first, an
enclosed polygon feature is formed (see illustration ).
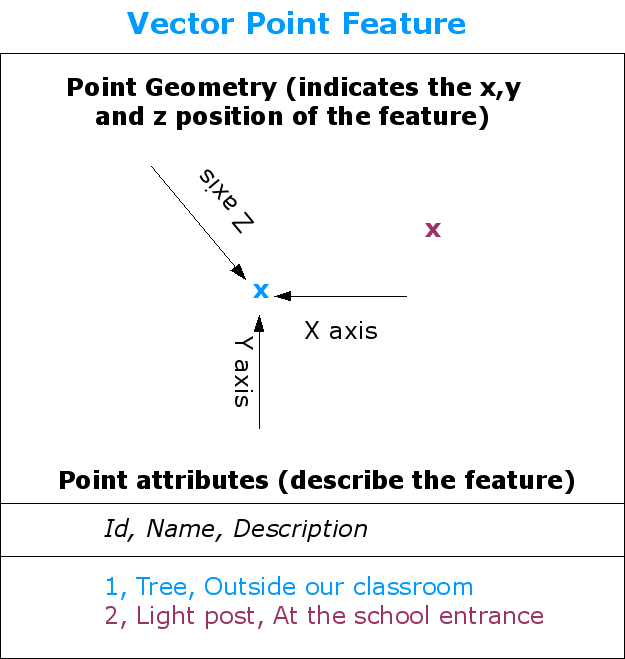
Рис. 3.14 Точечный объект описывается координатами X, Y и, опционально, Z. Атрибуты точки описывают её, например, что это дерево или фонарный столб.
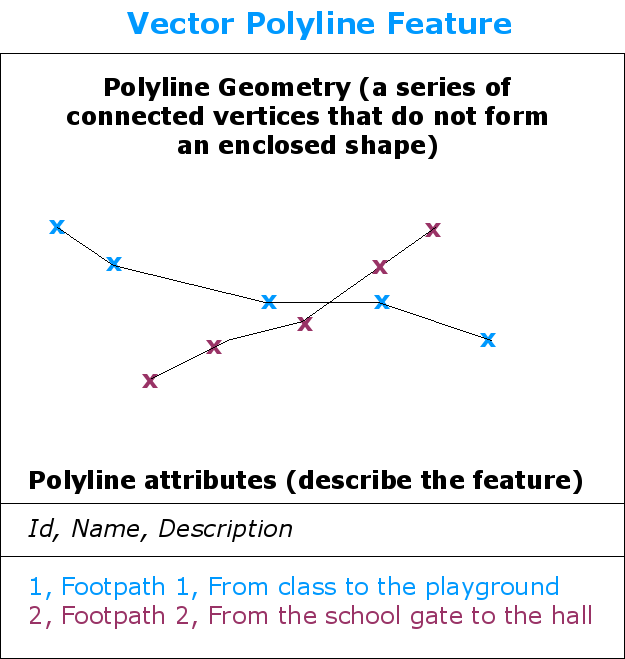
Рис. 3.15 Полилиния это последовательность соединённых узлов. Каждый узел имеет координаты X, Y (и, опционально, Z). Описывают полилинию её атрибуты.

Рис. 3.16 Полигон, как и полилиния, явялется последовательностью узлов. Однако, в полигоне первый и последний узел всегда совпадают.
Looking back at the picture of a landscape we showed you further up, you should
be able to see the different types of features in the way that a GIS represents
them now (see illustration ).
Примечания
- (англ.). OSGeo.org. Дата обращения: 24 мая 2020.
- (англ.). QGIS project. Дата обращения: 24 мая 2020.
- ↑
- ↑
- ↑ (англ.). OSGeo. — Страница проекта QGIS Desktop на сайте Фонда по открытому геопространственному ПО. Дата обращения: 24 мая 2020.
- ↑ Nicholas Duggan. (англ.). xyHt (3 September 2018). Дата обращения: 27 февраля 2019.
- (англ.). OSGeo. wiki.osgeo.org. Дата обращения: 27 февраля 2019.
- . www.qgis.org. Дата обращения: 27 февраля 2019.
- (англ.). GIS Geography (5 January 2019). Дата обращения: 27 февраля 2019.
- (англ.). GISGeography (4 March 2018).
- . qgis.org. QGIS. Дата обращения: 27 февраля 2019.
- (англ.). GitHub.
- . www.qgis.org. Дата обращения: 27 февраля 2019.
- ↑ (недоступная ссылка). Google Trends. Дата обращения: 27 февраля 2019.
- . www.google.com. Дата обращения: 27 февраля 2019.
- . Единый реестр российских программ для ЭВМ и БД. Минкомсвязь России.
- . NextGIS.
Debian/Ubuntu
Quickstart
Here you will simply install the latest stable QGIS (3.20.x Odense)
in your Debian or Ubuntu without having to edit config files.
Note
Although you see ‘Debian’ in some places, this also works for
‘Ubuntu’, as one is actually a symlink to the other on our server.
First install some tools you will need for this instructions:
sudo apt install gnupg software-properties-common
Now install the QGIS Signing Key, so QGIS software from
the QGIS repo will be trusted and installed:
wget -qO - https//qgis.orgdownloadsqgis-2021.gpg.key | sudo gpg --no-default-keyring --keyring gnupg-ringetcapttrusted.gpg.dqgis-archive.gpg --import
sudo chmod a+r etcapttrusted.gpg.dqgis-archive.gpg
Add the QGIS repo for the latest stable QGIS (3.20.x Odense).
Note: “lsb_release -c -s” in those lines will return your distro name:
sudo add-apt-repository "deb https://qgis.org/ubuntu $(lsb_release -c -s) main"
Update your repository information to reflect also the just added QGIS one:
sudo apt update
Now, install QGIS:
sudo apt install qgis qgis-plugin-grass
Note
Add ‘qgis-server’ to this line if you also want to install QGIS Server
Digitising
To make the existing Advanced Digitizing tools easier to use, we added an option to show the current distance/angle/x/y values as a floating display next to the mouse cursor.

This feature was funded by Kanton Schaffhausen
This feature was developed by Olivier Dalang and OPENGIS.ch
In QGIS 3.0, we added the ability to extend an existing line feature by clicking a “+” indicator at the start or end of line features when using the node tool. Version 3.8 extends this functionality by allowing addition of more than one vertex using the “+” button.

This feature was funded by Kanton Schaffhausen
This feature was developed by Olivier Dalang and OPENGIS.ch
Область карты
Also called Map canvas, this is the “business end” of QGIS —
maps are displayed in this area. The map displayed in this window
will depend on the vector and raster layers you have chosen to load
(see sections that follow for more information on how to load layers).
The map view can be panned, shifting the focus of the map display to
another region, and it can be zoomed in and out. Various other operations can be
performed on the map as described in the description above. The map
view and the legend are tightly bound to each other — the maps in view reflect
changes you make in the legend area.
Совет
Масштабирование карты с помощью колеса мыши
You can use the mouse wheel to zoom in and out on the map. Place the mouse
cursor inside the map area and roll the wheel forward (away from you) to
zoom in and backwards (towards you) to zoom out. The zoom is centered on the
mouse cursor position. You can customize the behavior of the
mouse wheel zoom using the Map tools tab under the
Settings ‣ Options menu.
Выражения
There is now a string format parameter available for the function in QGIS expressions. Users now have various options that they can use to stipulate the format of the returned UUID value, including the following options:
-
: {0bd2f60f-f157-4a6d-96af-d4ba4cb366a1}
-
: 0bd2f60f-f157-4a6d-96af-d4ba4cb366a1
-
: 0bd2f60ff1574a6d96afd4ba4cb366a1

This feature was developed by signedav
QGIS expressions now support a layer_crs variable which will return the AuthID for a particular layer’s coordinate reference system. This allows expressions to identify the layer CRS dynamically and perform transformations without needing to manually specify the CRS.
Разработчик — Alex
QGIS expressions now include aggregate functions for arrays, which allow the easy retrieval of specific values from an array that may be used in QGIS elements such as symbologies. The following functions have been introduced:
-
array_min
-
array_max
-
array_majority
-
array_sum
-
array_mean
-
array_median
Разработчик — uclaros
The function array_get now supports the use of negative index positions.
Разработчик — Alex
Подключение местных систем координат
В зависимости от версии QGIS подключение параметров местной системы координат (МСК) производится через следующие форматы:
- PROJ4 — для версий QGIS 3.8 и ниже;
- WKT — для версий QGIS 3.9 и выше.
Добавление местных систем координат в QGIS производится через меню «Установки / Пользовательские проекции…». Добавляем пользовательскую систему координат через нажатие на кнопку «+», затем прописываем название проекции в каталоге по строке «Имя». Далее выбираем необходимый формат описания проекции WKT или PROJ4.
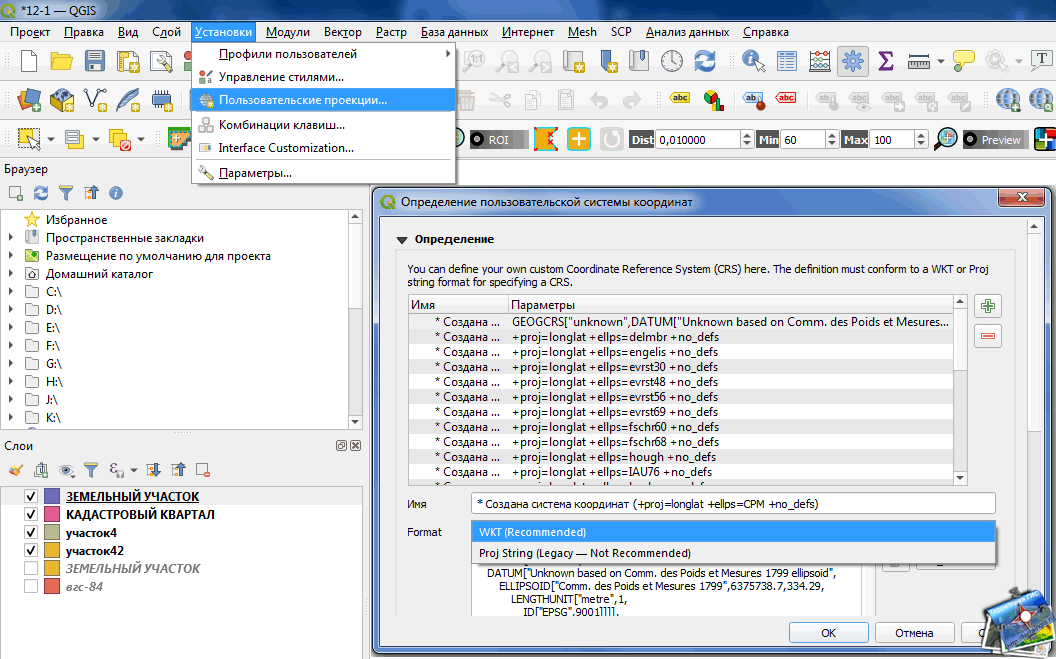 Формирование пользовательской системы координат в QGIS версии 3.14
Прописываем параметры проекции в зависимости от выбранного формата и проверяем его на правильность оформления через кнопку «Validate».
Для общего примера возьмем универсальные параметры местных систем координат для MapInfo. Ниже приведен пример строки проекции МСК-12 зоны 1 в формате для прописывания в файле проекций MapInfo:
МСК в формате PROJ4
На основе примера строки проекций для MapInfo в QGIS эта строка будет выглядеть следующим образом (смотрите внимательно некоторые параметры меняются знаки с «-» на «+»):
Структура файла PROJ4
https://youtube.com/watch?v=jW-aAfINj34%3F
МСК в формате WKT
Вот честно не могу сказать с какой версии произошел переход от proj4 к wkt по прописыванию параметров пользовательских проекций. Но тенденция к переходу к описанию проекций или систем координат через wkt-формат прослеживалась давно и рекомендовалась разработчиками данной программы. Покажем пример формирования такого файла в версии QGIS 3.14.
Структура файла WKT
история
| версия | Кодовое название | Дата выхода | Примечания и наиболее важные изменения |
|---|---|---|---|
| 0.0.1-альфа | Июль 2002 г. | Импорт и отображение данных PostGIS | |
| 0,0.3-альфа | 10 августа 2002 г. | Поддержка шейп-файлов и других векторных форматов | |
| 0,0.4-альфа | 15 августа 2002 г. | Улучшения в области слоев, цветов, отображения свойств в отдельном окне | |
| 0,0,5-альфа | 5 октября 2002 г. | Исправлены ошибки, повышена стабильность, теперь можно выбирать толщину линии, улучшены функции масштабирования. | |
| 0,0.6 | 24 нояб.2002 г. | Дальнейшие улучшения PostGIS, идентификация слоев, отображение и сортировка таблиц атрибутов | |
| 0,0.7 | 30 нояб.2002 г. | ||
| 0,0.8 | 11 декабря 2002 г. | ||
| 0,0.9 | 25 января 2003 г. | ||
| 0,0.10 | 13 мая. 2003 г. | ||
| 0,0.11 | 10 июня 2003 г. | ||
| 0,0.12 | 10 июня 2003 г. | ||
| 0,0.13 | 8 декабря 2003 г. | ||
| 0,1pre1 | 14 февраля 2004 г. | Добавлена поддержка растровых данных | |
| 0,1 | «Мороз» | 25 февраля 2004 г. | |
| 0,2 | «Тыква» | 26 апреля 2004 г. | |
| 0,3 | «Мэдисон» | 28 мая. 2004 г. | |
| 0,4 | «Младенец» | 4 июля 2004 г. | |
| 0,5 | «Бандит» | 5 октября 2004 г. | |
| 0,6 | «Саймон» | 19 декабря 2004 г. | |
| 0,7 | «Шеймус» | ||
| 0.7.3 | 11 октября 2005 г. | ||
| 0,8 | 7 января 2007 г. | ||
| 0.8.1 | «Титан» | 15 июня 2007 г. | назван в честь Титана |
| 0,9 | «Ганимед» | 26 октября 2007 г. | назван в честь Ганимеда |
| 0.9.1 | «Ганимед» | 6 января 2008 г. | |
| 0,10 | «Ио» | 3 мая. 2008 г. | имени Ио (англ.) |
| 0,11 | «Метис» | 21 июля 2008 г. | назван в честь Метиса |
| 1.0 | «Коре» | 5 января 2009 г. | имени Коре |
| 1.1 | «Сковорода» | 12 мая. 2009 г. | имени Пана |
| 1.2 | «Дафнис» | 1 сен 2009 г. | имени Дафниса |
| 1.3 | «Мимас» | 20 сен 2009 г. | имени Мимаса |
| 1.4 | «Энцелад» | 10 января 2010 г. | назван в честь Энцелада |
| 1.5 | «Тетис» | 29 июля 2010 г. | назван в честь Тетис |
| 1.6 | «Копьяпо» | 27 ноя.2010 | имени Копьяпо |
| 1,7 | «Вроцлав» | 19 июня 2011 г. | имени Вроцлава |
| 1,8 | «Лиссабон» | 21 июня 2012 г. | назван в честь Лиссабона |
| Старая версия; больше не поддерживается: 2.0 | «Дюфур» | 8 сен 2013 | имени Дюфуршпитце |
| Старая версия; больше не поддерживается: 2.2 | «Валмиера» | 22 февраля 2014 г. | им. Валмиеры , |
| Старая версия; больше не поддерживается: 2,4 | «Чугиак» | 27 июня 2014 г. | им. Чугиака, приход в округе Анкоридж |
| Старая версия; больше не поддерживается: 2,6 | «Брайтон» | 1 ноября 2014 г. | имени Брайтона |
| Старая версия; больше не поддерживается: 2,8 | «Вена» | 20 февраля 2015 г. | назван в честь Вены |
| Старая версия; больше не поддерживается: 2,10 | «Пиза» | 26 июня 2015 г. | назван в честь Пизы |
| Старая версия; больше не поддерживается: 2,12 | «Лион» | 23 октября 2015 г. | назван в честь Лиона |
| Старая версия; больше не поддерживается: 2,14 | «Есть» | 29 февраля 2016 г. | назван в честь еды |
| Старая версия; больше не поддерживается: 2,16 | «Нёдебо» | 22 июля 2016 г. | назван в честь Нёдебо, города в муниципалитете Хиллерёд |
| Старая версия; больше не поддерживается:2,18 ( LTS ) | «Лас-Пальмас» | 21 октября 2016 г. | Последняя версия в серии 2.x, названная в честь Лас-Пальмас-де-Гран-Канария. |
| Старая версия; больше не поддерживается: 3.0 | «Жирона» | 23 февраля 2018 г. | |
| Старая версия; больше не поддерживается: 3.2 | «Бонн» | 22 июня 2018 г. | |
| Старая версия; больше не поддерживается:3,4 ( LTS ) | «Мадейра» | 28 октября 2018 г. | |
| Старая версия; больше не поддерживается: 3,6 | «Нуса» | 22 февраля 2019 г. | |
| Старая версия; больше не поддерживается: 3,8 | «Занзибар» | 21 июн.2019 г. | |
| Старая версия; больше не поддерживается:3.10 ( LTS ) | «Ла-Корунья» | 25 октября 2019 г. | |
| Старая версия; больше не поддерживается: 3,12 | «București» | 21 февраля 2020 г. | |
| Старая версия; больше не поддерживается: 3,14 | «Пи» | 19 июня 2020 г. | |
| Старая версия; все еще поддерживается:3,16 ( LTS ) | «Ганновер» | 23 октября 2020 г. | |
| Актуальная версия: 3,18 | «Цюрих» | 23 февраля 2021 г. | |
|
|
Fedora
Получить пакеты для Fedora можно выполнив команду:
sudo dnf install qgis python3-qgis qgis-grass qgis-server
Default Fedora software repositories often hold older versions of
QGIS.
To have newer versions or the latest LTR, you have to add alternative software repositories
based on the version you want to install (stable, LTR or testing).
Стабильная версия
Enable the repository:
sudo dnf copr enable daniqgis
After that type the commands below to install QGIS:
sudo dnf install qgis python3-qgis qgis-grass
In case you would like to install QGIS Server (note that it’s not a common practice
to install both client and server applications on the same machine), type:
sudo dnf install qgis-server python3-qgis
|
Distribution |
Версия |
Версия QGIS |
GRASS GIS |
|---|---|---|---|
|
Fedora |
33 |
3.20 |
7.8 |
|
34 |
3.20 |
7.8 |
More information are available at https://copr.fedorainfracloud.org/coprs/dani/qgis/
5.1. Installing QGIS
QGIS project provides different ways to install QGIS depending on your platform.
Standard installers are available for MS Windows and macOS. Binary
packages (rpm and deb) or software repositories are provided for many flavors of
GNU/Linux .
For more information and instructions for your operating system check
https://download.qgis.org.
If you need to build QGIS from source, please refer to the installation
instructions. They are distributed with the QGIS source code in a file
called . You can also find them online at
https://github.com/qgis/QGIS/blob/master/INSTALL.md.
If you want to build a particular release and not the version in development,
you should replace with the release branch (commonly in the
form) in the above-mentioned link (installation instructions may differ).
It is possible to install QGIS (with all plugins and settings) on a flash drive.
This is achieved by defining a option
that overrides the default path and forces
QSettings to use this directory, too.
See section for additional information.
